

Choosing a Brisbane investment suburb usually starts with the wrong question: which suburb will grow the most? No one can answer that reliably. Not a data provider, not a buyer’s agent, not a broker. Any article that tells you otherwise is guessing.
The more useful question is: which suburb’s numbers actually match your strategy? A high yield unit market and a tightly held, low vacancy house market solve different problems for different investors.
This guide compares six Brisbane bayside and Redlands suburbs: Wynnum, Manly, Morningside, Carina, Birkdale and Wellington Point. It compares the data points that actually drive an investment decision, being entry price, rental yield, vacancy conditions, renter demand, dwelling mix, and verified infrastructure.
Every figure below is sourced and dated. Where a data point genuinely does not exist at suburb level, such as suburb specific vacancy rates, we say so rather than filling the gap with a regional number dressed up as local.
Why These Six Suburbs
Wynnum, Manly and Morningside sit within Brisbane City Council, on or near the Cleveland rail line running into the CBD. Carina is a Brisbane City Council suburb further inland, bordering the Carindale retail and transport corridor. Birkdale and Wellington Point fall under Redland City Council, in the Redlands, Brisbane’s bayside investment catchment with materially different price entry points and dwelling stock to the inner bayside suburbs.
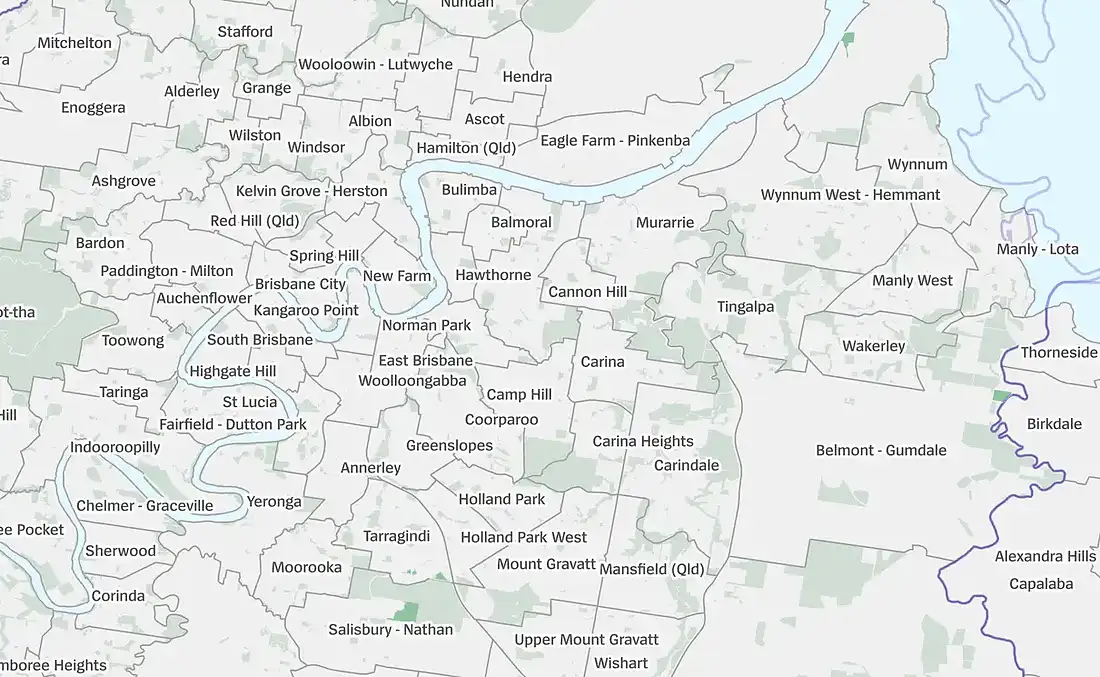
Together they give a genuine spread: from Brisbane’s most expensive bayside pocket (Manly) to its most affordable in this set (Birkdale), and from a renter majority unit market (Morningside) to overwhelmingly owner occupier house markets (Birkdale and Wellington Point).
At a Glance: 2026 Suburb Data Comparison
| Suburb | LGA | Median House | Median Unit | House Yield | Unit Yield | 12 Month House Growth |
|---|---|---|---|---|---|---|
| Wynnum 4178 | Brisbane | $1,385,000 | $860,000 | 2.94% | 3.86% | +10.80% |
| Manly 4179 | Brisbane | $1,909,000 | $850,000 | 2.64% | 3.61% | +20.06% |
| Morningside 4170 | Brisbane | $1,600,000 | $948,500 | 3.02% | 3.84% | +23.08% |
| Carina 4152 | Brisbane | $1,420,000 | $1,015,000 | 3.12% | 3.91% | +14.52% |
| Birkdale 4159 | Redland | $1,267,500 | $807,000 | 3.28% | 3.98% | +5.98% |
| Wellington Point 4160 | Redland | $1,380,000 | $825,000 | 3.25% | 3.90% | +12.20% |
Source: Your Investment Property Mag, CoreLogic sourced suburb data, 12 months to June 2026 (Birkdale to May 2026). Gross rental yields, unadjusted for costs. Growth figures are historical and not an indicator of future performance.
A pattern worth noting, not a verdict: the two Redlands suburbs, Birkdale and Wellington Point, have the lowest entry prices and the highest gross yields in this set on both houses and units. The Brisbane City Council suburbs show a wider spread. Manly commands the highest median house price but the lowest house yield, which is the normal trade off between capital value and rental return.
Rental Yield: What the Gap Actually Means
Gross yield ranges from 2.64% (Manly houses) to 3.98% (Birkdale units) across this set. That is a real difference in cash flow, not a rounding error.

A $1,909,000 Manly house returning 2.64% gross generates roughly $50,400 a year in rent before costs. A $807,000 Birkdale unit returning 3.98% gross generates roughly $32,100. That is a smaller dollar figure, but a materially better yield to purchase price ratio, and a much smaller loan to service.
Neither is objectively better. A lower yield, higher value suburb like Manly is typically a capital value play, where the investor is prepared to fund a larger gap between rent and mortgage repayments.
A higher yield suburb like Birkdale or Carina reduces that funding gap and can materially change loan serviceability outcomes, because lenders count a portion of rental income toward borrowing capacity.
This is where the yield comparison stops being a spreadsheet exercise and starts affecting what you can actually borrow. It is worth modelling before you fall in love with a suburb. Our investment loans Brisbane page explains how lenders currently treat rental income in serviceability assessments.
Guessing Your Borrowing Power? Stop.
Yield comparisons mean nothing until you know what a lender will actually approve. Get your real number in one free call.
Vacancy Rates: The Suburb Level Data Gap
Here is an honest limitation. No data provider, not SQM Research, not CoreLogic, not the ABS, publishes a rental vacancy rate at individual suburb level for Wynnum, Manly, Morningside, Carina, Birkdale or Wellington Point specifically. Vacancy data in Australia is only reliably compiled at local government area or capital city level.
Any article quoting a precise vacancy percentage for one of these six suburbs by name is presenting a regional figure as if it were suburb specific. We will not do that.
What we can report accurately:
- Brisbane LGA vacancy rate: 0.9% for July 2026, flat month on month and unchanged year on year, one of five capital cities sitting under 1% (SQM Research data, released 13 August 2026).
- Redland City (Redlands) vacancy conditions: local reporting places rental vacancy across the mainland Redlands between 0.9% and 1.3% through the first half of 2026, well below the 2.5% to 3.5% range generally considered a balanced rental market (Redland Bayside News, 8 September 2026, reporting on local market conditions rather than a named statistical release).
Both figures point in the same direction: this is a tight rental market across bayside Brisbane and the Redlands, which supports rent growth and low holding vacancy risk for landlords in the general area. It is a regional signal, not proof of conditions on any one street.
Entry Price and Affordability Spread
For an investor working to a budget, the price gap between suburbs matters as much as the yield gap:
- Lowest house entry in this set: Birkdale, $1,267,500 median.
- Highest house entry: Manly, $1,909,000 median. That is a $641,500 gap for houses in the same broad bayside catchment.
- Unit entry range: from $807,000 (Birkdale) to $1,015,000 (Carina).

Interestingly, Carina has the highest median unit price in the set despite a mid range house price. Its unit stock, 34.2% semi detached or townhouse per ABS data against 54.7% separate houses, skews toward larger townhouse style products rather than compact apartments, which lifts the median.
For a buyer priced out of Manly or Morningside houses, Birkdale and Wellington Point represent a genuinely different entry point in the same broad rail corridor. This is not a compromise suburb, it is a different asset profile: predominantly separate houses, lower unit stock, higher owner occupier rates.
Renter Profile and Dwelling Mix
This is the data point most investment content skips, and it directly affects what kind of property performs in each suburb. Figures are from the ABS 2021 Census, the most recent published Census data at suburb level.
| Suburb | Renter Households | Separate Houses | Flats or Units |
|---|---|---|---|
| Wynnum | 34.6% | 70.8% | 16.2% |
| Manly | 30.0% | 70.6% | 16.1% |
| Morningside | 47.0% | 40.8% | 27.4% |
| Carina | 33.1% | 54.7% | 11.1% |
| Birkdale | 19.0% | 83.9% | 4.7% |
| Wellington Point | 20.0% | 89.1% | 4.3% |
Source: ABS 2021 Census QuickStats, by suburb (SAL).

Morningside stands apart. Renters make up 47% of households and separate houses are a minority of the dwelling stock (40.8%), with semi detached or townhouse and flat or apartment product making up the rest.
That is a fundamentally different rental market to Birkdale or Wellington Point, where 80% to 90% of dwellings are separate houses and roughly four in five households own rather than rent. Neither structure is better for every investor.
A unit in a renter majority suburb like Morningside faces different tenant demand dynamics to a house in an owner occupier dominated suburb like Wellington Point, and the two should be underwritten differently.
Suburb Snapshots
Wynnum (4178)
Brisbane City Council is progressing the Wynnum Centre Suburban Renewal Precinct, adopted into the City Plan in June 2026, and a 20 year Wynnum, Manly and Lota Foreshores Master Plan, aimed at improving connectivity between Wynnum Central station and the foreshore and supporting additional housing.
Served by three stations on the Cleveland line. If you are weighing up finance for a purchase here, our mortgage broker in Wynnum page covers local lending options in more depth.
Manly (4179)
The most expensive entry point in this comparison and the lowest gross yield, offset by the largest 12 month house growth figure in the set at plus 20.06%, and Brisbane’s largest marina, the 41.8 hectare Manly Boat Harbour. Also covered by the Foreshores Master Plan above. See our Manly QLD mortgage broker page for local finance guidance.
Morningside (4170)
The highest renter share and highest median unit price in this set, on a Cleveland line station a short trip from the CBD. We could not verify a Morningside specific Cross River Rail or Brisbane 2032 linked infrastructure project. Its transport advantage is the existing Cleveland line, not a confirmed new project, and we are not going to claim otherwise. More detail at our Morningside mortgage broker page.
Carina (4152)
Sits between the inner bayside suburbs and the Carindale retail precinct, with the highest unit yield (3.91%) and highest unit median price in the comparison, reflecting a larger share of townhouse style stock.
We could not verify a Carina specific 2026 infrastructure project in this research pass, so we are not listing one. Local lending detail: mortgage broker in Carina.
Birkdale (4159)
The most affordable entry point and highest yields, both houses and units, in this comparison, and home to a confirmed Brisbane 2032 Olympic and Paralympic Games venue: the Birkdale Whitewater Centre (canoe slalom), part of the broader Birkdale Community Precinct.
Federal environmental approval was reconfirmed in September 2026, with enabling works expected from 2027. This is a genuine, dated infrastructure catalyst, not a rumour. See our Birkdale mortgage broker page.
Wellington Point (4160)
The highest owner occupier rate and lowest unit stock in the set, at 89.1% separate houses, anchored by the Wellington Point Jetty and King Island sandbar, a lifestyle drawcard rather than a growth catalyst.
In the interest of a balanced picture, the area has also experienced increased aircraft noise since Brisbane Airport’s second parallel runway opened in 2020, which is worth factoring into tenant appeal for properties under the flight path. Local finance detail: mortgage broker in Wellington Point.
Matching the Data to Your Strategy
Rather than picking a winner, match the numbers above to what you are actually trying to achieve.
Chasing Cash Flow
Birkdale and Wellington Point currently offer the highest gross yields and lowest entry prices in this set, which typically narrows the gap between rent received and loan repayments.
Building a House Only, Owner Occupier Style Rental Pool
Birkdale (83.9% houses) and Wellington Point (89.1% houses) have the least unit exposure and the highest owner occupier rates, which can mean lower tenant turnover in the surrounding market.
Comfortable With Unit or Townhouse Exposure for a Lower Entry Price
Wynnum and Morningside have the highest proportion of unit and semi detached stock, with Morningside’s renter majority profile suggesting stronger structural rental demand for that product type.
Budget Constrained but Wanting a Brisbane LGA Postcode
Wynnum’s $860,000 unit median is the lowest Brisbane City Council entry point in this comparison.
Considering an Investment First, Rent Elsewhere Approach
If you are weighing up buying an investment property in one of these suburbs while continuing to rent somewhere else, that is a distinct strategy with its own trade offs. Our rentvesting in Brisbane guide walks through how it works.
Buying From Overseas
If you are a UK expat or non resident considering a Brisbane investment purchase, FIRB rules, deposit requirements and tax obligations differ from a resident purchase. See our dedicated buy to let mortgage guide for UK expats.
None of this tells you which suburb will grow fastest over the next five years, because that figure does not exist yet for anyone.
Financing an Investment Purchase in These Suburbs
The data above affects more than which suburb you choose. It affects how a lender will assess your application.

Rental income and serviceability. Most lenders count 70% to 80% of a property’s rental income toward your borrowing capacity, with the remainder shaded to account for vacancy and costs, on top of the APRA mandated serviceability buffer applied to your interest rate.
A higher yield suburb can meaningfully improve your borrowing position. A lower yield, higher value purchase generally requires more of your own serviceability to carry it.
Loan purpose and interest deductibility. How an investment loan is structured, and whether it is kept separate from your own home loan, affects the tax deductibility of the interest. Cross collateralising an investment purchase against your home loan is common practice among some lenders but can create complications later, particularly if you want to sell or refinance one property independently of the other.
Gearing and holding costs. Whether a property is negatively or positively geared depends on the specific yield, loan size and your personal tax position, not the suburb alone. Our guide to positive and negative gearing in Brisbane breaks down how each works.
As a mortgage broker in Brisbane comparing loans across 30 plus lenders, we can model how a specific property’s yield and price affects your borrowing capacity and loan structure before you make an offer, not after.
Which Suburb Fits Your Budget? Find Out Today.
We compare 30 plus lenders so you do not have to. Talk to a Brisbane bayside mortgage broker now, with no obligation and no cost to you.
FAQs
Which of these six suburbs has the best rental yield?
On the data above, Birkdale currently has the highest gross yields in this comparison, being 3.28% on houses and 3.98% on units (CoreLogic sourced data, 12 months to May 2026). Yield fluctuates with both price and rent movements, so this is a snapshot, not a fixed ranking.
Is a suburb specific vacancy rate available for these areas?
No. Vacancy rate data in Australia is published at capital city and local government area level, not by individual suburb. The closest verified figures are Brisbane LGA (0.9%, July 2026, SQM Research) and reported Redlands wide conditions (0.9% to 1.3%, first half of 2026).
Will these suburbs keep growing at the same rate?
No one can guarantee that, and we will not claim otherwise. The growth figures in this article are historical, recorded price movement over the past 12 months, not a projection. Property values can rise, fall or stay flat, and past performance is not a reliable indicator of future results.
Which suburb is cheapest to buy into?
Birkdale has the lowest median house ($1,267,500) and unit ($807,000) prices in this comparison.
Can I use rental income from an investment property to help me borrow more?
Generally yes. Most lenders count a portion, commonly 70% to 80%, of rental income toward serviceability, subject to their own policy and the APRA serviceability buffer. The exact treatment varies by lender, which is one reason comparing multiple lenders matters for an investment purchase.
A Note on This Data
Every figure in this article is sourced and dated at the time of writing, September 2026: price and yield data from Your Investment Property Mag’s CoreLogic sourced suburb profiles, dwelling and tenure data from the ABS 2021 Census, vacancy data from SQM Research and Redland Bayside News as cited, and infrastructure facts from Brisbane City Council, Redland City Council and local news reporting. Where a genuine data point was not available at suburb level, such as vacancy rates and a small number of infrastructure claims for Morningside, Carina and Wellington Point, we have said so rather than estimating.
This article is general information only, not personal financial or investment advice, and does not account for your individual circumstances. Property values, rents and yields change, and historical performance does not predict future results. Speak with a licensed financial adviser about your investment strategy and with us about your finance options.